The cPanel Interface
Valid for versions 128 through the latest version
Last modified: 2025 June 9
Looking for this interface?
Your hosting provider can enable or disable this interface in WHM's Feature Manager interface (WHM >> Home >> Packages >> Feature Manager).
Overview
The cPanel interface is the hub of your cPanel user account and provides you with access to important information and updates. The Tools page is the default home page.
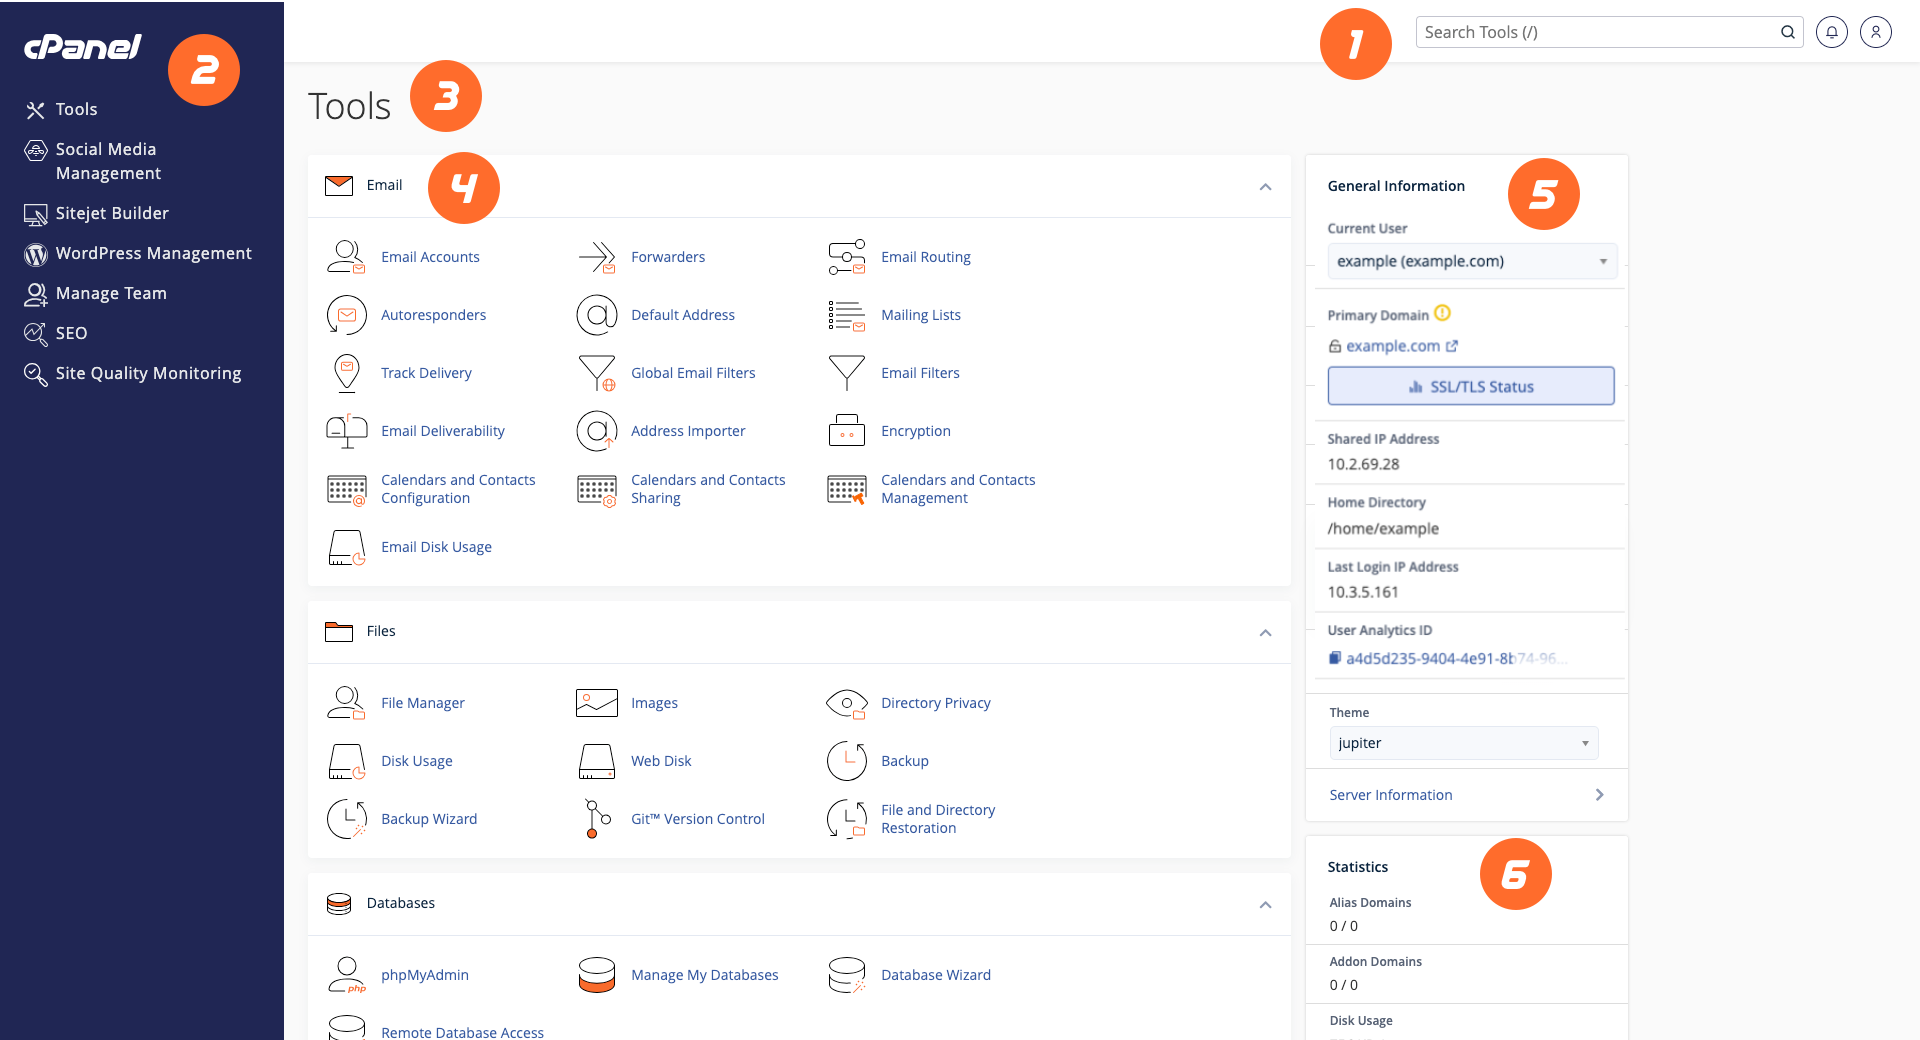
The cPanel interface consists of the following sections:
- Your hosting provider’s server profile may disable certain features in the cPanel interface. For more information, read our How to Use Server Profiles documentation.
- If your server administrator has enabled cPanel Analytics at the server level, a graph icon (
 ) will appear on the right side of the interface.
- Click the icon to display your account-level cPanel Analytics settings. Select whether This account is for an individual or This account is for a business. Then, select the By checking this box, you agree that we may collect your usage statistics. checkbox and click Save to enable cPanel Analytics for your account.
- cPanel, L.L.C. values your privacy. For more information about how we collect and use cPanel Analytics data, read our cPanel Analytics documentation.
Onboarding Assistant
The Onboarding Assistant only appears for new cPanel account users and provides a starting point for using the cPanel interface.
For more information, read our Onboarding Assistant documentation.
Navigation bar
Every interface in cPanel displays the navigation bar. The navigation bar provides the currently-active account information, the search bar, and controls that allow you to change settings and log out of your account.
- Use the Search text box to quickly find the interfaces that you need.
Note:
Use the forward slash (
/) keyboard shortcut to quickly access the Search Features text box. - To open the cPanel account menu, click the cPanel account icon (
 ). Here you can manage your account preferences, change your password, change language, update your contact information, give feedback, or log out.
- To reset the cPanel interface, click your username and then click Reset Page Settings in the user menu.
- If your Notifications icon has a red dot on the bell (
 ), you have a message, warning, and/or error on your cPanel account. Click the Notifications icon to display them. Server owners can also customize this interface to broadcast important information to their customers.
The Main Menu
The Main Menu allows you to navigate to the Tools page from any interface. You can also access the following features:
- Social Media Management
- Sitejet Builder
- WordPress Management
- Manage Team
- Search Engine Optimization
- Site Quality Monitoring
Every interface in cPanel displays the Main Menu. To return to your default cPanel home page at any time, click the cPanel logo.
The Tools page
Features
The cPanel interface lists of all of your account’s available features in groups for different types of functionality. You can click and drag the feature groups to customize their order.
General Information
The General Information section displays the following information about your cPanel account:
Current User
The name of the current cPanel account. If you are a reseller or a root user, you can switch between cPanel accounts.
Primary Domain
The current account’s primary or main domain name. Click the SSL/TLS status button to navigate to cPanel’s SSL/TLS Status interface (cPanel » Home » Security » SSL/TLS Status). A warning (![]() ) icon appears if a problem exists with the status of the certificate. This section also displays the type of certificate that secures the primary domain:
) icon appears if a problem exists with the status of the certificate. This section also displays the type of certificate that secures the primary domain:
- DV Certificate — A domain-validated certificate.
- EV Certificate — An extended-validation certificate.
- OV Certificate — An organization-validated certificate.
- Self-signed Certificate — A self-signed certificate.
- No Valid Certificate — A valid certificate exists, but it does not currently secure the domain. For example, an expired or revoked certificate.
Shared IP Address or Dedicated IP Address
The current account’s shared or dedicated IP address.
- A shared IP address means that multiple websites within one server use a single IP address.
- A dedicated IP address means that the website possesses its own IP address.
Home Directory
The absolute path to the account’s /home directory on the server.
Last Login IP Address
The IP address of the user that most recently logged in to the account.
This IP address is not the currently-authenticated IP address. For example, if you log in via the 10.1.1.1 IP address, and then log in multiple times via the 10.2.2.2 IP address, the interface will display 10.1.1.1 as the Last Login IP address value. It will not display 10.2.2.2 as the Last Login IP address value until you log in through a different IP address.
Site Quality Monitoring banner
This banner will not appear if you have already set up Site Quality Monitoring or if your hosting provider has disabled Site Quality Monitoring.
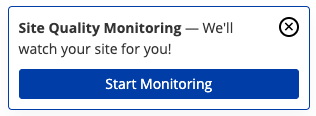
If you have not already signed up for Site Quality Monitoring, the following banner may appear in the General Information section of the Main Menu:

To begin monitoring, you may click Start Monitoring to open the Site Quality Monitoring interface and begin the sign-up process (cPanel » Home » Metrics » Site Quality Monitoring). Site Quality Monitoring allows you to monitor websites for common issues, such as low SEO ranking and performance problems.
To dismiss this banner permanently, click the X icon (![]() ).
).
User Analytics ID
The User Analytics ID is the Universally Unique Identifier (UUID) automatically generated for your cPanel account. For more information, read our cPanel Analytics documentation.
Theme
The current cPanel theme. If your account includes more than one theme, you can use the menu to search for and switch between cPanel themes.
NGINX Caching
The status of NGINX® caching for the account. This section displays either Active or Inactive, depending on the NGINX caching status.
If your hosting provider allows you to manage whether NGINX uses caching or not, you can set the toggle to either Active or Inactive. If NGINX caching is active for your account, you can also click Clear Cache to clear the NGINX cache.
This category only appears if your hosting provider installed NGINX.
Server Information
Click this link to navigate to cPanel’s Server Information interface (cPanel » Home » Server Information), which displays additional information about the account and its server.
Statistics
The Statistics section displays important usage statistics for your cPanel account. This section displays information about your cPanel account’s resource usage.
Symbols and Buttons
Each statistic may display one of the following:
| Symbol or Button | Description |
|---|---|
| A warning ( |
This icon indicates one of the following: |
An infinity symbol (∞) |
This icon indicates an unlimited quota. Otherwise, the interface displays your account’s quota limits. |
| An Upgrade button | Click this button to increase the quota for this statistic in your hosting plan. The Upgrade button only appears if your hosting provider has added integration links to your server. |
| A Manage button | Click the Manage button to access the relevant cPanel interface where you can reduce your quota usage. For example, if your Email Accounts statistic is high, you can delete unused email accounts in cPanel’s Email Accounts interface (cPanel » Home » Email » Email Accounts). |
An exclamation mark (!) icon |
Hover your cursor over this symbol to read more information about the error. This symbol appears if your server cannot retrieve more information about the usage or quota limit for your server. |
Statistics Details
| Statistic | Description |
|---|---|
| Bandwidth | This displays the amount of data, in megabytes (MB), transferred for the current month. This also displays your monthly bandwidth limit for inbound and outbound data. If you want to modify your bandwidth limit, contact your hosting provider.
Note:
If discrepancies exist between the information that cPanel provides and the information that the AWStats, Webalizer, and Analog log processing programs provide, read our Apparent Discrepancies in Bandwidth Usage Statistics documentation. |
| Disk Usage | This statistic displays the amount of disk space, in megabytes (MB), that your account currently uses. You will only see this statistic if your hosting provider’s server profile supports disk usage. |
| File Usage | This statistic displays the number of files and directories (inodes) that your account currently uses. You will only see this statistic if your hosting provider enables it. The interface will display this statistic as Local File Usage for a distributed cPanel account. This is the account’s current local server current usage. It does not include the file usage from the child node. |
| Database Disk Usage | This displays the amount of disk space, in bytes, that your account’s MySQL® or MariaDB® databases currently use. You will only see this statistic if your hosting provider enables MySQL or MariaDB databases on your server. |
| PostgreSQL Disk Usage | This displays the amount of disk space, in bytes, that your account’s PostgreSQL® databases currently use. You will only see this statistic if your hosting provider enables PostgreSQL databases on your server. |
| Mailing Lists Disk Usage | This displays the amount of disk space, in bytes, that your account’s Mailman mailing lists currently use. |
| Addon Domains | This displays the number of addon domains that your account currently uses. |
| Subdomains | This displays the number of subdomains that your account currently uses. |
| Aliases | This displays the number of aliases (parked domains) that your account currently uses. |
| Email Accounts | This displays the number of email accounts that your account currently uses. |
| Mailing Lists | This displays the number of Mailman mailing lists that your account currently uses. |
| Autoresponders | This displays the number of autoresponders that your account currently uses. |
| Forwarders | This displays the number of forwarders that your account currently uses. |
| Email Filters | This displays the number of email filters that your account currently uses. |
| FTP Accounts | This displays the number of FTP accounts that your account currently uses. |
| Manage My Databases | This displays the number of MySQL or MariaDB databases that your account currently uses. You will only see this statistic if your hosting provider enables MySQL or MariaDB databases on your server. |
| PostgreSQL Databases | This displays the number of PostgreSQL databases that your account currently uses. You will only see this statistic if your hosting provider enables PostgreSQL databases on your server. |
| CPU Usage | This displays the amount of CPU that your account currently uses. You will only see this statistic on servers that run CloudLinux™. |
| Memory Usage | This displays the amount of memory that your account currently uses. You will only see this statistic on servers that run CloudLinux™. |
| Entry Processes | This displays the number of entry processes that your account currently uses. You will only see this statistic on servers that run CloudLinux™. |
